CloudOps Kubernetes Observability
An end-to-end observability project that brings together Kubernetes deployment, application metrics, dashboards, centralized logging, and alerting.
Project Overview
CloudOps Kubernetes Observability is a containerized Flask application deployed on Kubernetes with a monitoring and logging stack.
The application runs as multiple replicas behind a Kubernetes Service. Helm manages the application deployment, while Prometheus collects metrics, Grafana displays dashboards, and Loki with Grafana Alloy provides centralized application logging.
The project was built and tested locally on Ubuntu using Docker and kind.
System Architecture
Data pipeline flow from client port forwarding through the local cluster, metrics collection, and alerting channels.
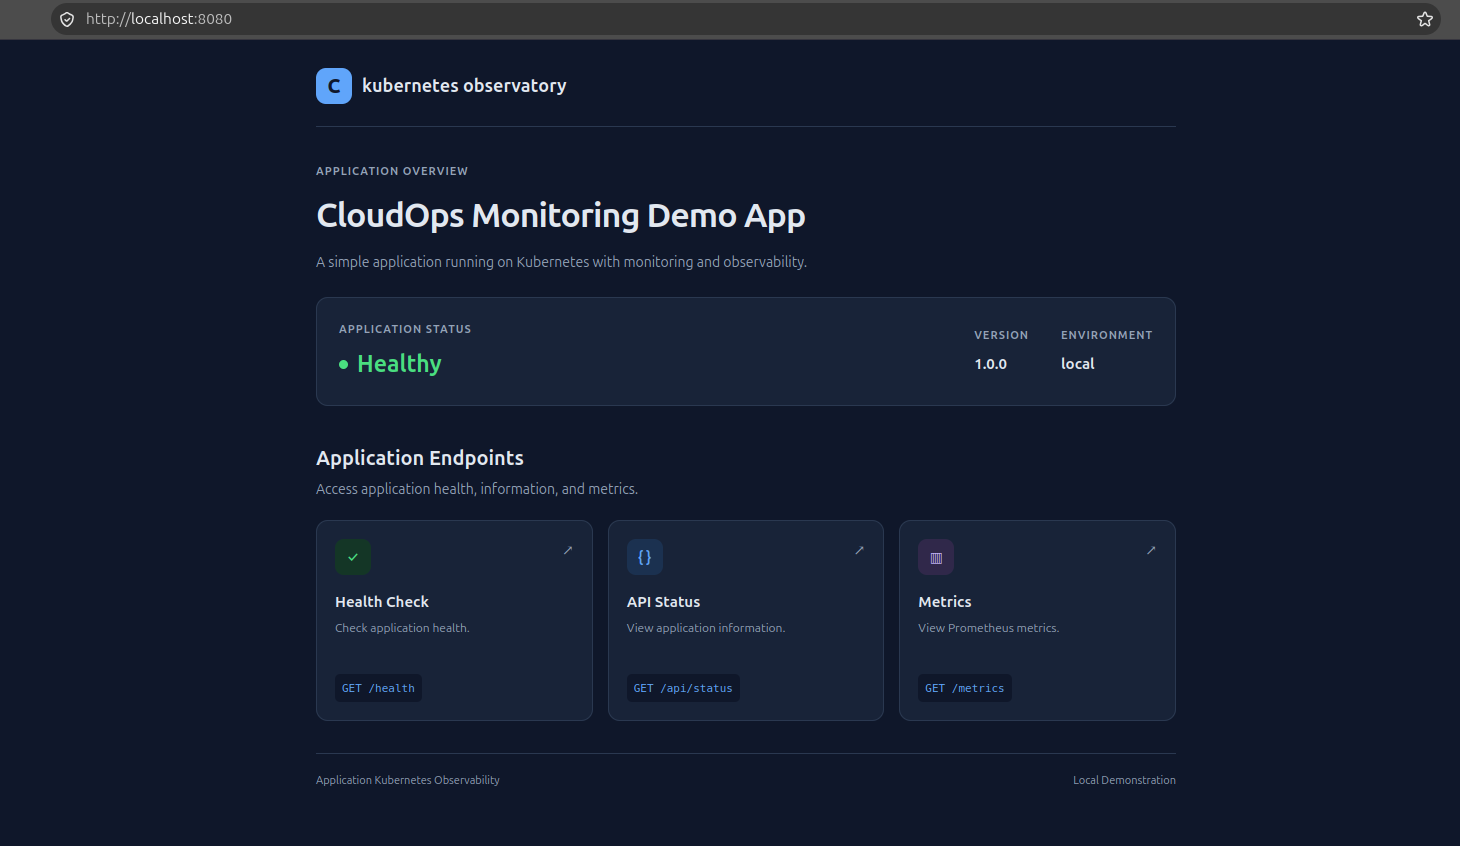
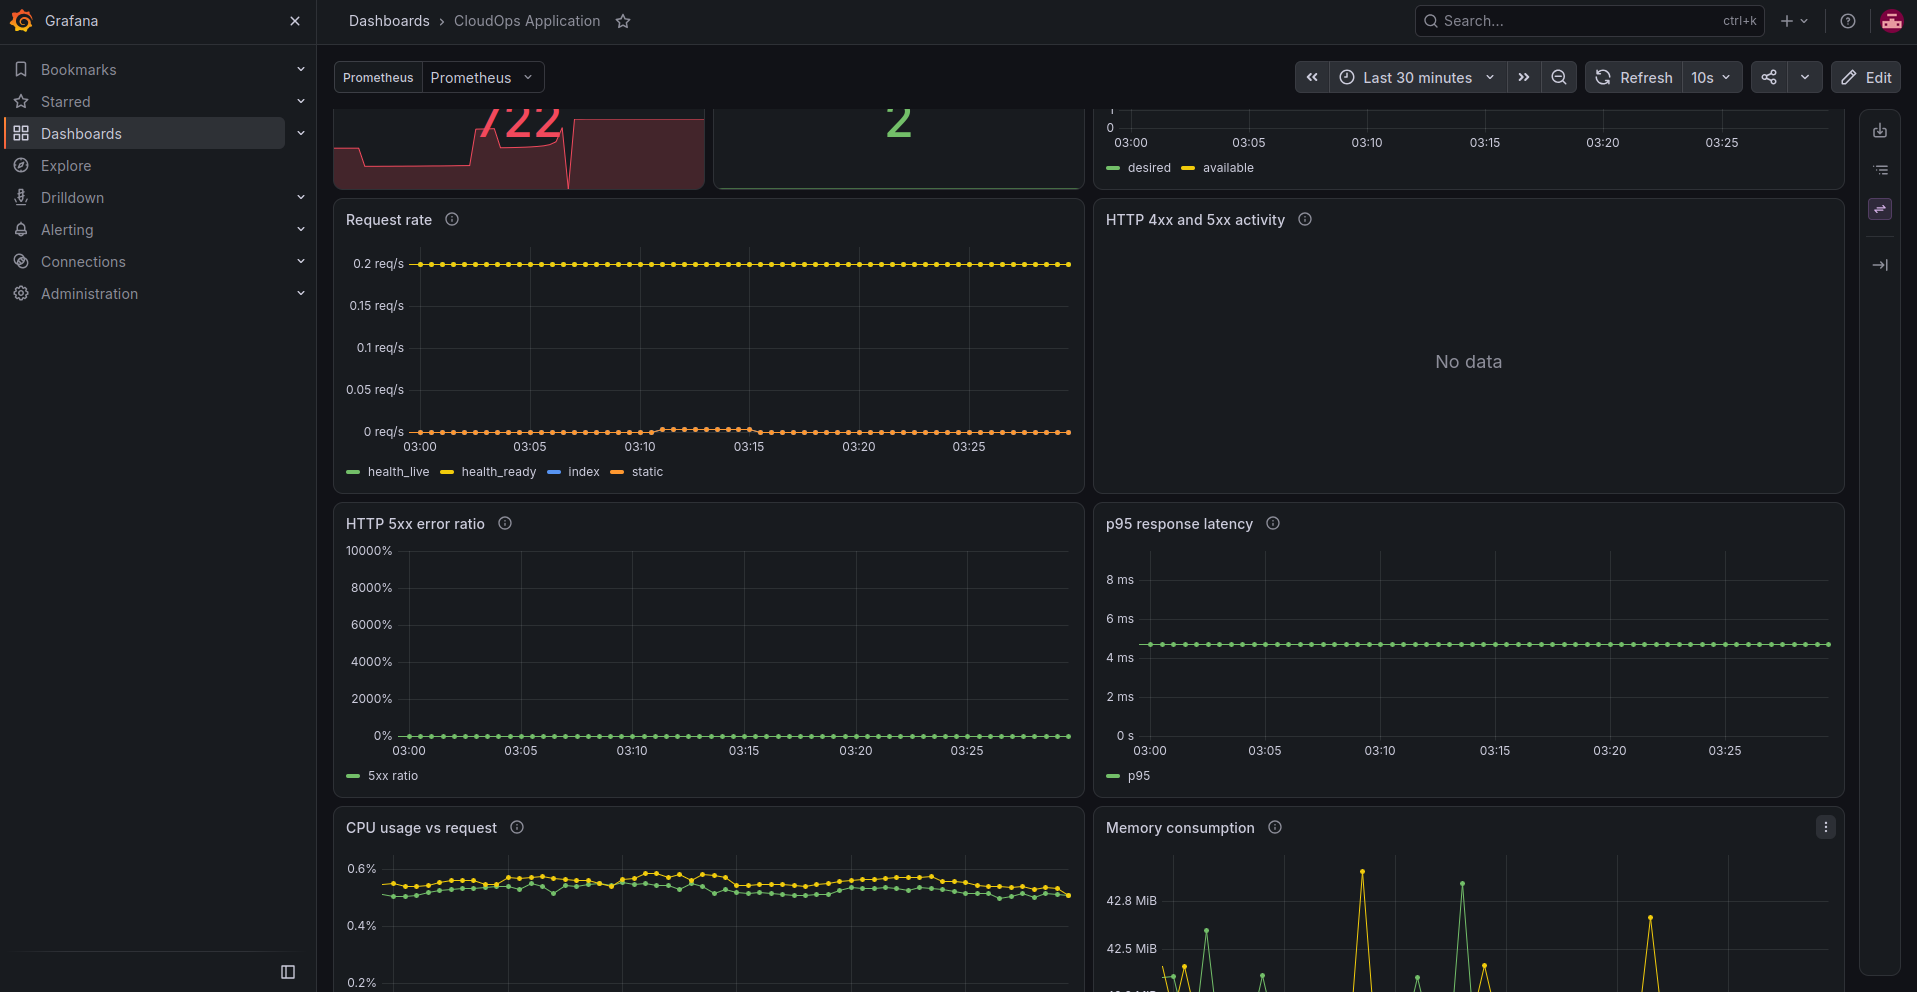
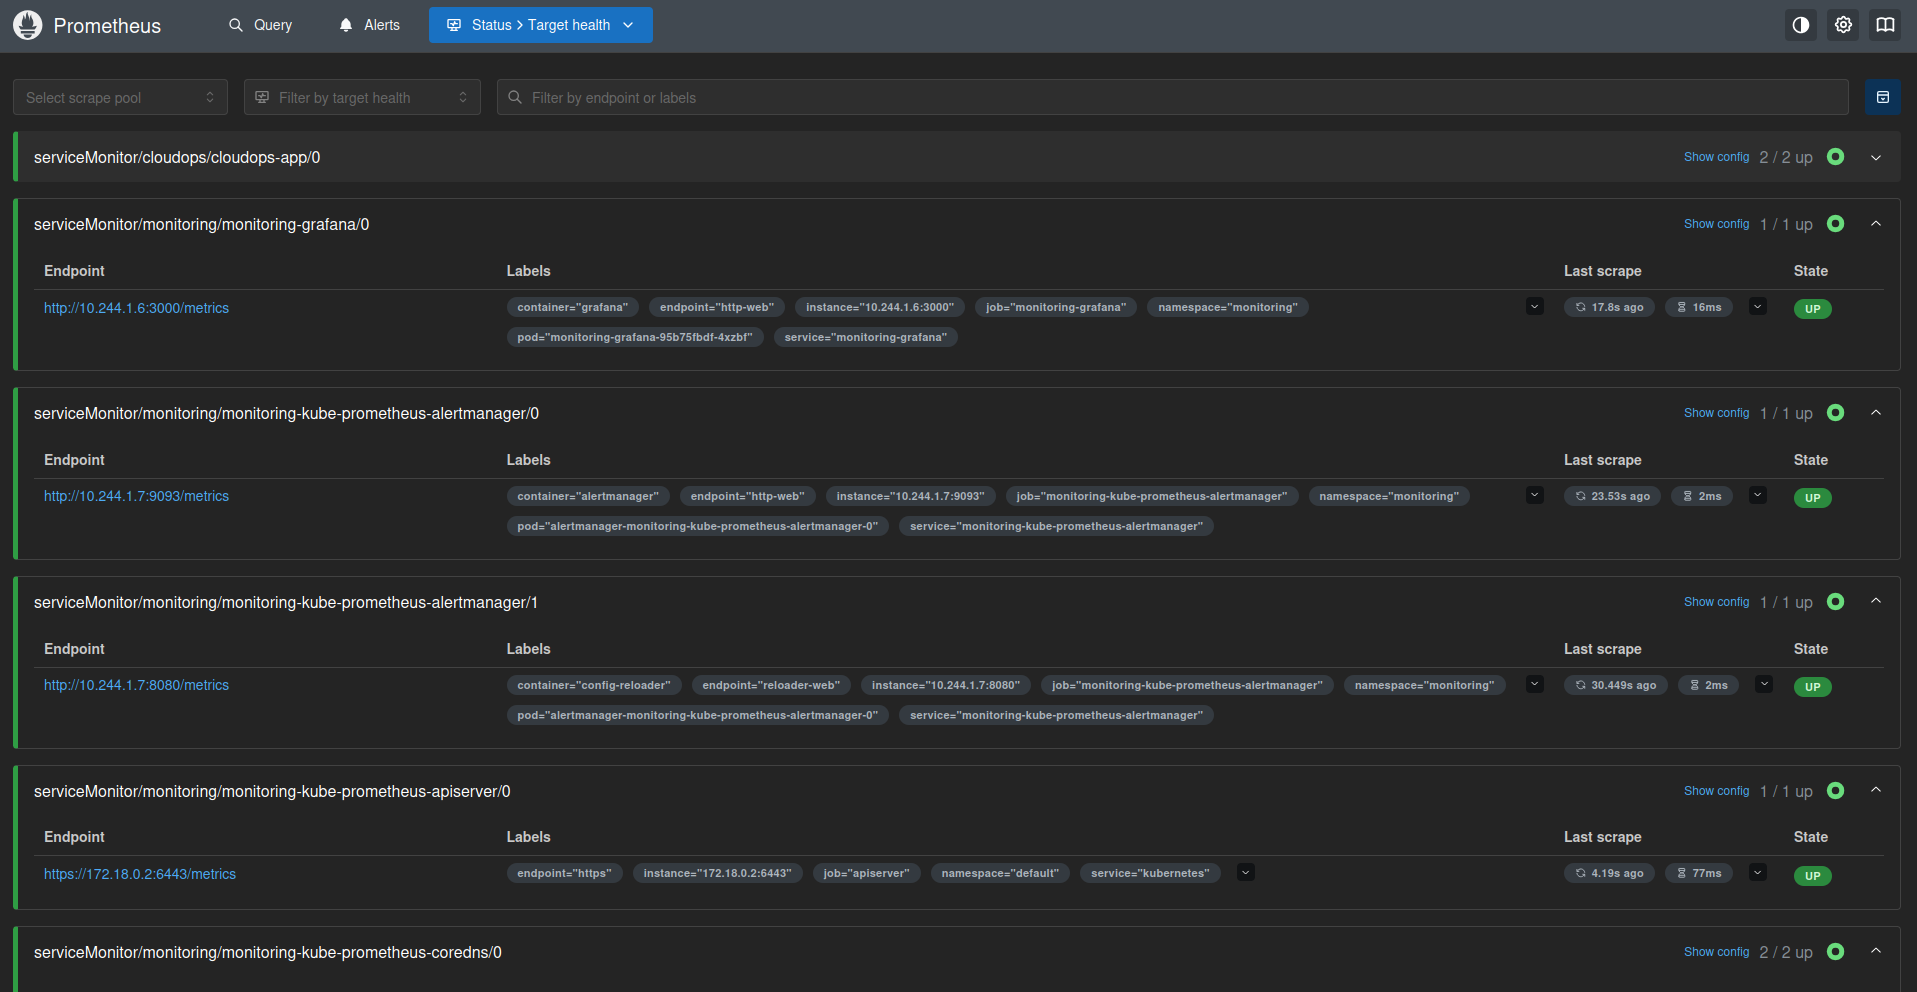
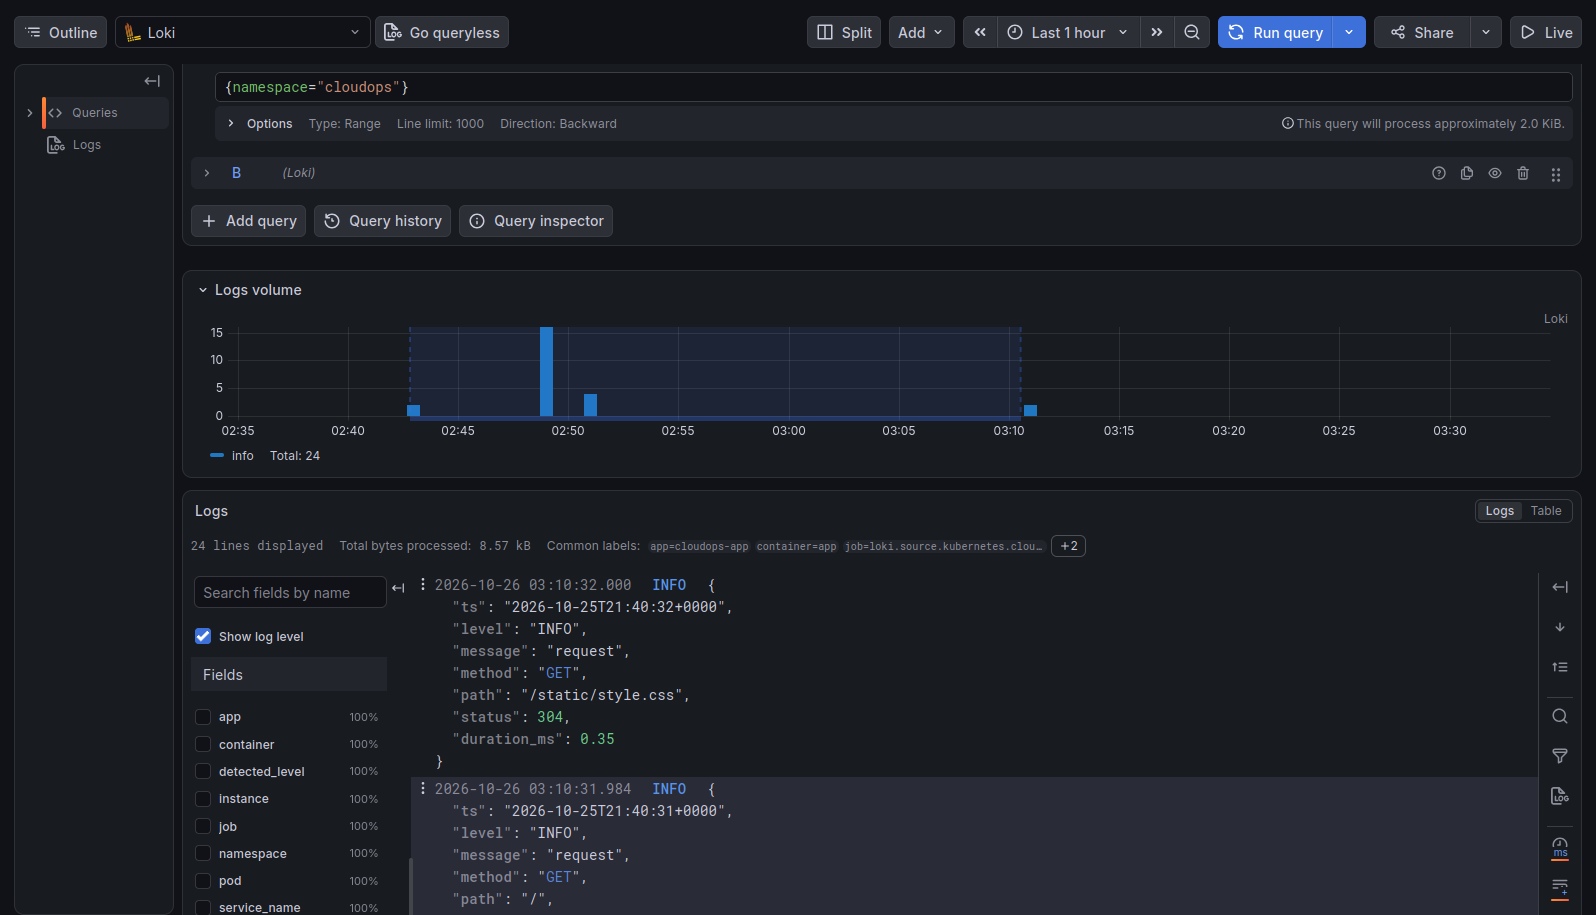
Project Screenshots
Interfaces captured directly from the local Kubernetes observability deployment.
Key Engineering Features
Core implementation aspects across cluster configuration, telemetry, logging, and automated testing.
Kubernetes Deployment
- Multi-replica application Deployment.
- ClusterIP Service for internal traffic routing.
- ConfigMaps, Secrets, and ServiceAccounts.
- Readiness and liveness probes.
Containerization & Packaging
- Docker image built locally.
- Helm chart for Kubernetes resource management.
- Helm upgrades and rollback support.
Metrics & Dashboards
- Application metrics exposed through /metrics.
- Prometheus scraping through a ServiceMonitor.
- Grafana dashboard for monitoring.
- Metrics Server integration for CPU-based autoscaling.
Centralized Logging
- Grafana Alloy discovers application Pods and collects logs.
- Loki stores and indexes the collected log streams.
- Logs can be queried through Grafana Explore.
Alerting
- Prometheus alert rules for application availability, elevated HTTP 5xx error rates, and unavailable replicas.
- Alertmanager integration for alert handling.
Testing
- pytest-based application tests.
- Health, readiness, and status endpoint verification.
Technical Implementation
Overview of the decoupled technologies working together in the local environment.
Application
Flask provides the web interface, health endpoints, status information, and Prometheus metrics.
Containerization
Docker packages the application and its dependencies.
Orchestration
kind provides a local Kubernetes cluster for deployment and validation.
Deployment
Helm manages the application's Kubernetes resources and configuration.
Observability
Prometheus collects metrics, Grafana visualizes them, and Loki with Grafana Alloy handles application logs.
Autoscaling
Horizontal Pod Autoscaler uses CPU metrics from Metrics Server to manage the application's replica count.
Skills Demonstrated
Environment & Scope
Built to understand how applications run and are monitored inside Kubernetes.
This project combines containerization, Kubernetes deployment, metrics collection, centralized logging, and alerting into a single local observability environment.
Back to Projects